Inspecting the Vivaldi UI with DevTools
-
Developer Tools allow us to inspect Vivaldi’s user interface and debug our modifications. Trying to access DevTools the usual way (keyboard shortcuts, inspect from menu, etc.) won’t necessarily give us access to the interface, however. In the following section we want to look at different ways how to achieve this.
Loading DevTools
Loading DevTools for the UI requires us to open one out of a set of specific pages first.
- Open
vivaldi://inspect/#apps/and click “inspect” beneath the second line (Vivaldi window.html). - Open
vivaldi://settings/(in a tab), orvivaldi://experiments/, orvivaldi://mail/and load DevTools with a keyboard shortcut, Quick Commands, or menu entry (e.g.Main Menu → Tools → Developer Tools). - Enable “Show Introduction” for private windows in
vivaldi://settings/privacy/. Open a private window, load DevTools.
DevTools will always load in a new window; we are not able to attach them to the current window. Depending on our setup and preferences, we can create bookmarks for these pages with optional nicknames, dedicated menu entries for both the pages and the different DevTools commands (Element Inspector and Console) and custom keyboard shortcuts. This assures DevTools for the UI are only ever a few clicks, or keystrokes, away. Alternatively we can create a command chain in
vivaldi://settings/qc, which automates the process:Command chain name: Inspect UI
- Open Link in New Tab
Parameter:vivaldi://experiments - Delay
Parameter:50 - Developer Tools
- Close Tab
Using DevTools
A short introduction in 2 examples.
Element Inspector
The element inspector allows us to look up selectors for the elements we intend to modify. Let’s change the font color of the active tab.
-
Open DevTools and click the element picker button (mouse pointer) on top left. It turns blue.
-
Hover the active tab in the Vivaldi window and move around until you see the span element with the
.titleclass.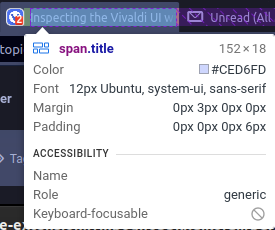
-
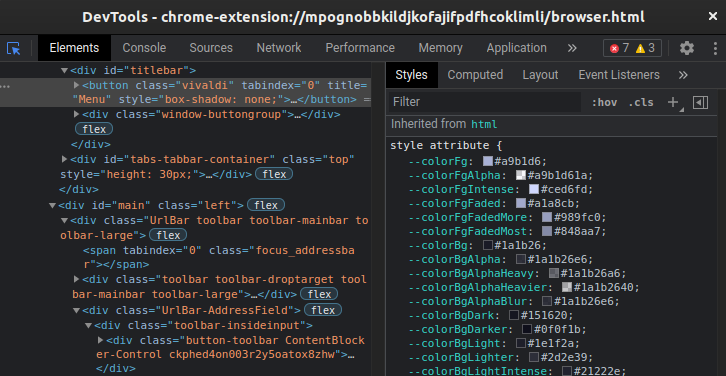
Click to select the tab title. The element is being highlighted in the “Elements” tab, which represents the page source of the user interface.
-
A second section inside the tab contains the “Styles” tab either at the side or beneath. In the source we can find the selectors, the style shows the CSS acting on the selected element. Scroll down until you find the command that changes the color of the active tab.
-
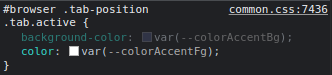
Click on
var(--colorAccentFg)(this is an example, the color could be different in your theme), pressbackspace, inputredand pressenter. This changes the font color, but only temporarily (until reload). -
Should you have the experiment for using CSS modifications enabled in
vivaldi://experiments/(see Modding Vivaldi), you can both access and edit your modification files in the DevTools. Click on the “Sources” tab and in the sidebar expandvivaldi-dataand thencss-mods. Click on your mod file, the contents will be shown right next to it. Since we know how Vivaldi changes the color of the active tab, we can use the same code in our file to overwrite Vivaldi’s instructions. Change the color togreenthis time and notice how the change is immediately visible.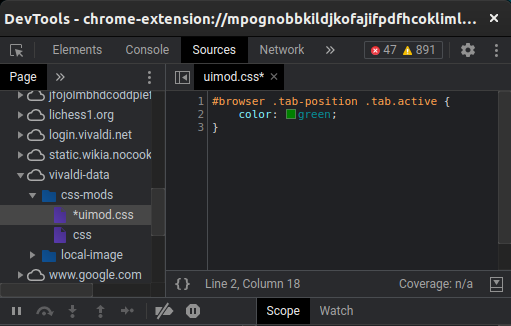
-
This is a temporary modification too. However, we can make our edit permanent by right‐clicking and selecting “Save as...”. Choose the location of the mod file to overwrite, or save the edit as backup.
Reloading the user interface
The standard way of performing edits is opening our mod file in a proper text editor, editing, saving and reloading the UI. Here a few options to load the changes:
- Exit Vivaldi and open it again.
- Open a new browser window.
- Select all tabs and move them to a new window. This is available as a menu entry when right‐clicking a tab and has the advantage of keeping webpages and media playback active.
- Restart Vivaldi. The URL
vivaldi://restart/will restart Vivaldi when it is being opened in the current tab. We can either enter the address directly in the address field, or use a bookmark. One nifty option is to save the address, assign a nickname to it (e.g.re) and load it with quick commands.shift‐/alt-enterwill open in current tab, when bookmarks are set to open in a new tab by default and vice versa; this is dependent on our search, bookmarks and quick commands settings.
All the actions load the
browser.htmlfile anew, which in turn loads our modification files.
Console
Let’s write a “Hello, World!” example script for testing our Javascript setup as described in Modding Vivaldi.
-
Open the Javascript modification file in a text editor.
-
Copy and paste following code and save.
setTimeout(function wait() { const browser = document.getElementById("browser"); if (browser) console.log("Hello, World!"); else setTimeout(wait, 300); }, 300); -
Reload the user interface and load DevTools.
-
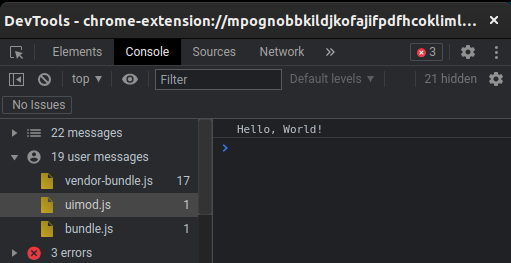
Click the “Console” tab, our message should be visible.
-
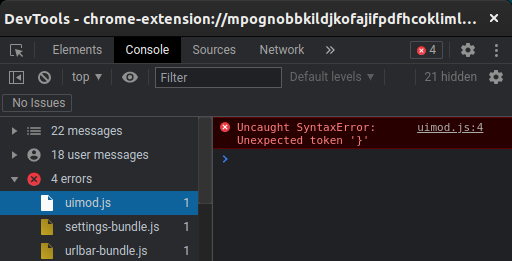
Now we introduce an error. Delete the first line of the script and reload UI.
-
Open DevTools and switch to the console. Vivaldi detects the error at line 4, where the closing bracket is located. We deleted the opening bracket, so this is expected. Console logs are one way to test the functionality of our mods and find errors—use them to your advantage.
I hope these instructions have been helpful. For further questions post a reply, we have a healthy community willing to help you out.
- Open
-
What do you mean? I don't quite follow.
-
@liyin Oh, now I get it.
Just right click and inspect, the Speed Dial is part of Vivaldi's UI and can be accessed like all the other parts. -
To enable this feature you have to run Vivaldi with following command line:
--flag-switches-begin --debug-packed-apps --silent-debugger-extension-api --flag-switches-endIt doesn't matter much, but something I noticed a while back is that just appending
--debug-packed-apps --silent-debugger-extension-apiis enough.
--flag-switches-beginand--flag-switches-enddon't actually do anything, they're just informational brackets that vivaldi://about/ shows to indicate things set with vivaldi://flags. -
@Isildur Interestingly on osx you can even drop the
-extension-apipart at the end, no idea why, but it still works. -
Is it possible to use the React Dev Tools while inspecting Vivaldi's UI? I installed the React Dev Tools and they work fine on regular web pages, but I don't see the "React" tab when inspecting Vivaldi's UI itself.
-
@daniel15 I don't know, but probably not. Since it's an extension it tries to inspect the site, not the application. You should probably contact an extension developer about this to make sure.
-
Thank you for posting these instructions for everyone's benefit. I had found them using the old forum links, but it is good for everyone else.
")
-
Hey, so recently I've been having issues with this. Most of the time when I start the browser using these flags I still can't inspect the UI on a right-click. But every once in a while it does work. I can't figure out why, and it's started getting really annoying when I'm trying to mod stuff. Any ideas?
Win 10 x64 BTW.
-
@narsis Yeah, I'm having the same problems since 1.13 (when they changed the underlying UI code) -- and they didn't get fixed in 1.14. At least one other user I know, has these issues too. The browser tries to simulate the restart (or reload) and fails, sometimes freezing all tabs and controls. That's why I stopped using simulated restarts altogether for the time being. Instead I wrote a script that closes and opens Vivaldi (in inspect mode) automatically. Is a workaround but surprisingly fast.
-
@luetage I've found that just selecting all tabs and moving them into a new window works, as that loads a new instance of the browser.html
-
I rewrote the top entry to show all ways of opening devtools/inspecting Vivaldi’s UI. I searched the forums for additional options, but didn’t come up with anything. I can dimly recall that there was at least one other way to open up a fresh tab with the background page listening on a port. Somebody remembers this?
-
- open settings in a tab & press the inspect shortcut
-
@potmeklecbohdan That works without the flag?
-
@luetage Yes—I’ve tried it with a clean user data dir. The only condition is that the settings are in a tab.
-
@potmeklecbohdan Damn, nice find. That’s probably the easiest way now.
-
@luetage said in Inspecting Vivaldi's UI with devtools:
Damn, nice find
Actually not found by me, IIRC. But it’s been quite a long time ago, so I don’t know who’s pointed me to it…
Oh, & you got me wrong—not by the context menu, but by the keyboard (
F12orCtl-Sft-Iby default). -
@potmeklecbohdan Ah, I understand. Tested it just now, settings seems to be the only page this works on.
-
I was thinking this thread, or a summarized guide from it, would be good to have pinned in this category. I think the thread itself is fine, but if the mods/folks think otherwise I could give writing a summary a go, but I'm not certain that's necessary.
The topic, however, is such a crucial task when it comes to modifying Vivaldi, that I think it would benefit the community to have it pinned -- both for newcomers as well as those searching for it to share with newcomers.
I post from my phone frequently, which likes to change "the" to "three". If you see three or similar, I probably meant "the". I use swipe, so typos can be totally unrelated words to what I intended. Knowing this should help you read through my typos.
-
@BoneTone In addition to your excellent suggestion [& though i'm replying to you coz it was your idea, the following question is addressed to anyone], regarding the OP:
@luetage said in Inspecting Vivaldi's UI with devtools:
Open devtools without browser restart: Visit vivaldi://inspect/#apps and click “inspect” below the browser.html entry at top.
Over the last few years i've become slightly less-bad at using Inspect from right-click to delve into ordinary websites to make various aesthetic mods via CSS. However to date wrt actual V UI mods i have had no idea at all & thus have merely relied on the hard work of others in the forum from whom i've borrowed various clever UI mods.
The method i quoted above seems potentially interesting to me, but once the little windowlet opens, it's not apparent to me how to use it for inspecting parts of the UI. If someone has already explained this in another thread, could you pls link it to me so i can read it & try to learn?