Quickly inspect element in developer tools
-
Hey there,
I've just recently migrated from Firefox to Vivaldi, but there's one feature I'm desperately missing. I'm a webdeveloper working mostly on html and css so I very frequently inspect elements. In Firefox I used to be able to right click an element and press Q on my keyboard to open that element in the dev tools. In Vivaldi I don't have this option unfortunately, it takes more steps than that. Sometimes I can right click it and then inspect it with pressing D, then pressing I. But sometimes pressing D doesn't open the submenu and it doesn't work... Either way Q was much easier since it's where my left hand is on the keyboard while my right hand is on the mouse.Is there any way to do something similar like this in Vivaldi? If it's something I could build in an extension please let me know, I'd be willing to build that extension. That's how bad I'm missing this

Kind regards,
Rien -
Using “Inspect” in the context menu works perfect for me.
-
@barbudo2005 it does for me too, but it's nested in a submenu nowadays so I can't trigger it with one button press
-
-
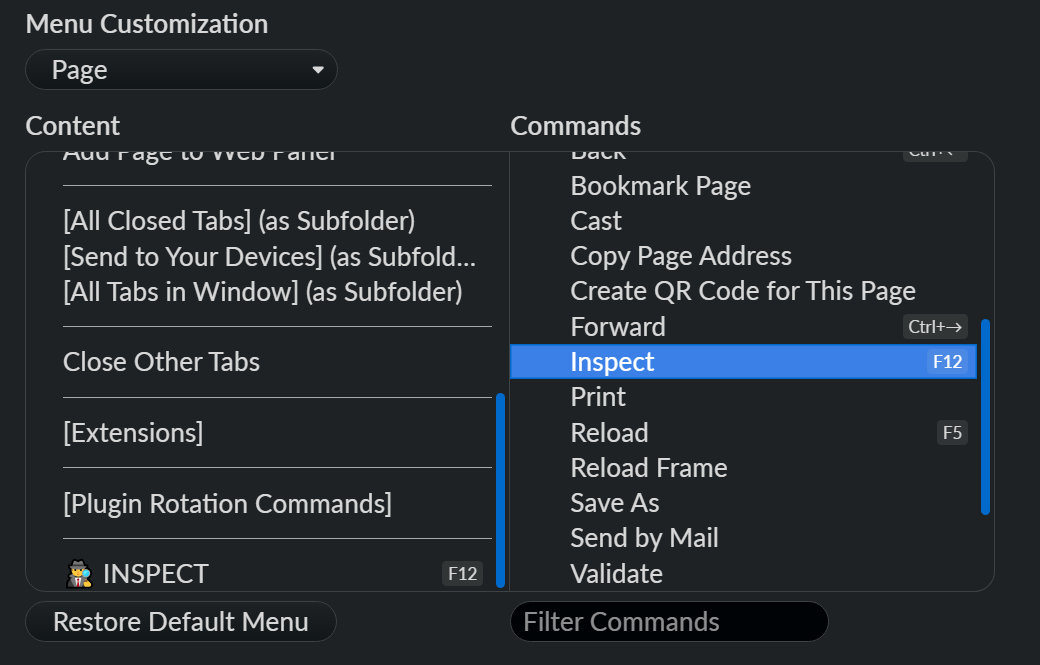
@rienheuver Move it the menu entry ]into context menu.
Open Settings → Appearance → Menu
For Webpage select each entry below
Go to entry "[Developer Tools] (as Subfolder)"
Open context menu
untick "Show as Subfolder"Then you will have it all in one menu.
-
You guys are heroes! I had been searching in the settings to customize that menu, but hadn't found it somehow. I've now just put an 'Inspect' entry atop each of the Web Page menus so I can always access it with 'I'. This is so much better... Thanks a lot!
Using a different letter (such as Q) for it would make it completely perfect, but this is already a long way there
-
-
@Pathduck Not a bad addition to the toolkit, might take some getting used but I'm definitely gonna try it out! Have to say, so far love the customisation of Vivaldi, it's truly incredible
-
@rienheuver Or...
- Edit the Page etc context menu
- Add Toggle Developer Tools on the first level
- Rename it as
Toggle Developer Tools (&Q)to make Q always the shortcut - Excactly like Firefox
")

This is basically what I do, except the
&Qbit.
Vivaldi rewards those willing to spend some time learning the many ways to customize it instead of expecting it to behave exactly like they're used to
-
@Pathduck I think you meant to say to edit
InspecttoInspect (&Q), because that works exactly as I hoped Is there a way I could have known about this
 (&<character>)syntax? Either way, you're my hero. Thanks so much! -
@rienheuver It's a bit confusing to me as well, the difference between Inspect and the others, as a non-developer.

They have also renamed these in Snapshots making it more confusing...

I believe "Developer Tools Elements" toggles the element picker directly.
Is there a way I could have known about this (&<character>) syntax?
This is documented here:
https://help.vivaldi.com/desktop/appearance-customization/customize-application-and-context-menus/#RenameThanks so much!
You're welcome

-
@Pathduck I think neither is the
InspectI was mentioning. Let me give a brief explanation to a non-developer if you're interested:The Developer Tools is the entire bar that you can open/close with
Ctrl+Shift+IorF12. If you try out you'll see there's a few tabs in that toolbox we use as developers. Toggling the toolbar will remember on which tab you last were, so it opens that one up again if you toggle the thing open. The 'Elements' tab is the one we use the most and 'Console' comes in second place; that's why there's separate keyboard shortcuts probably, so you can open them up even faster.Inside the 'Elements' tab you can see the build-up of the web page, defining all the links, text elements, images, all structural blocks et cetera. You can click on the various elements and see some info about it in the toolbox. I use that all the time to look up things about specific elements. That's the Inspecting part of it. So if I right click on an element in the web page and hit 'Inspect' it will open up the info about that element right away: it focuses that element in the 'Element' tab of the 'Developer Tools'.
And thanks to your help I can do that very quickly now! Simply by right clicking it with my right hand (mouse) and then hitting Q on my keyboard (left hand)
 Such an oddly specific thing that someone add Mozilla nailed for my workflow, but that Vivaldi can facilitate with ease as it appears
-
@rienheuver The toggle developer tools command will remember your last tab. The developer tools elements command will open in inspect mode. This is a recent change, toggle developer tools used to be inspect and developer tools toggled the last used tab. This was confusing, I’m glad they changed it up. Interestingly they even fixed up our command chains containing these commands automatically.
Personally I have the devtools elements command as a button in the address bar, toggle devtools and devtools console on F12 and Ctrl F12.
-
@luetage What do you mean with 'Inspect mode', the selection option that you can trigger with
Ctrl+Shift+Cif you have the developer console open? Because currently that's not (yet) the case for me, but perhaps I'm still missing an update