Need a warning about running out of memory!
-
My Windows has 16 GB of RAM. I have never seen any utility report Vivaldi using more than 2 GB of it. But almost daily I try to open a tab, it is drawn, and then grayed out under the dead bird. At that point if I try Firefox it opens, draws the start page, and disappears. Chrome turns the entire screen white and locks up.
The Vivaldi dump file, viewed in WinDbg, shows:
PRIMARY_PROBLEM_CLASS: APPLICATION_FAULT_OOM_vivaldi.exe!out_of_memory
Given the other browsers' behavior, I believe that.The problem is how to know what triggers Vivaldi to suddenly jump from 2GB of memory to all of it. I'm never viewing anything unusual, no big video, no games, just random web pages. I can't really keep Task Manager or Resource Monitor on top of my web results all day and watch them in case Vivaldi is about to run amok...
Is there some tool or setting in Vivaldi that could warn us when it is consuming unusual amounts of memory?
Original Surface Book, Win10; System76 gazp9, Arch Linux; iPad 12.9 5Gen; iPhone SE2020; synched...
-
@LorenAmelang Are you perhaps using the 32-bit version of Vivaldi? If your OS supports 64-bit then install the 64-bit version to access all of your 16 Gbytes of RAM.
-
I don't quite get it, every browser of yours is hanging or crashing most probably of what @Pesala said but only Vivaldi should inform you what is triggering it, while the others are ok for not reporting it? You should care about how to fix your memory problem in the first place, not about why any browser does not warn you. The OS warns about excessive memory, not the software. If on the other hand all that matters to you is having a visual memory meter, there are dozens of those programs around, in the taskbar, in the tray, or as widgets, always on top with transparency/opacity and whatnot.
-
@LorenAmelang What specifically makes you think it's Vivaldi causing the OOM? You say you've never seen it report more than 2GB in use, so something else is going on. I suspect something on your system is using all your memory.
Unless you're a tab hoarder with hundreds of tabs open, 16GB should be more than enough. Maybe your page file is not correctly set up, but again, 16GB should mean memory would rarely need to be paged to disk at all.
Have you looked at the internal task manager in Vivaldi (Shift+ESC)? It would show you what resources each tab and extension uses.
I'm assuming Windows10 here, older Win versions might not be so good at memory management. Then again, they would usually just Bluescreen instead of the application crashing and dumping when OOM.
I don't know if an application running in user-space would even know how much memory is used by the OS - applications leave memory management to the underlying OS as they rightly should.
Can you show a graph from for instance Process Explorer of memory usage over time? Maybe one of your extensions has a nasty memory leak...
-
Hi,
Welcome to Vivaldi's Forums!First of all,
Try on a New 's Profile:
- "Right side" |

Rename it as Tests or something related, and use it as a Clean Profile, to test without custom configurations that can alter the original operation.
Since the result, check:
- Active Experiments
- Extensions
- Clean Cache
- Site Data
Or fill in a Bug Report and please, add the ID to the topic for follow up.
--
"Off Topic Tip"
Follow the Signature's Backup | Reset link.
Take the opportunity to start a Backup plan and even create a Template Profile.
Windows 7 (x64)
Vivaldi Back up | Reset - "Right side" |
-
@LorenAmelang , welcome to the community. And yes, I think what they say, that there must be an external problem, my laptop only has 8Gb and I have never experienced an excessive use of RAM or CPU with Vivaldi, rather the opposite inferior to the others Browsers I use.
-
Forgot to mention,
If you can't reach the menu because V becomes unresponsive, follow this steps.
-
Wow - Thanks for all the responses!
First, my bad, this Surface Book is 8 GB, I was thinking of my Linux machine which is 16.
Vivaldi 3.0.1874.38 (Stable channel) (64-bit)
Revision ca1a7297a62038cd7ef1a841248d749a0346cc41
OS Windows 10 OS Version 1909 (Build 18363.836)The other browsers crashed when I tried to open the page that just failed in Vivaldi. Usually the dead bird page will work in another browser, so I try that first. Seeing the other browsers unable to open suggests a memory problem, so later I dug out the minidump and yes, Vivaldi knows it is out of memory. Windows does not know, apparently Vivaldi kindly backs off and kills the page before Windows notices a problem. The other browsers failing also do not cause a problem for Windows.
I am curious why every time something like this happens, there are Windows Updates waiting to be installed, but that's probably just because there are always updates waiting...
The internal task manager in Vivaldi agrees with Resource Monitor and Process Explorer about the size of memory items. I'll definitely look there first next time I suspect a memory problem.
I don't expect Vivaldi to duplicate system wide memory monitors. But instead of showing the dead bird, like it does for lots of other reasons, maybe it could pop up an "out of memory" warning? The dump files clearly show it knows that's the cause of this dead bird.
I don't know any way to retrieve memory usage for the past incident, but I just tried to duplicate it, by opening every URL in my BrowsingHistoryView of the incident - and not closing any of them. (In reality, over half of them got closed before moving to the next tab.)
That starts with Vivaldi having today's six new tabs already open, plus BrowsingHistoryView and Process Explorer that weren't running yesterday. And it still didn't pass "the" limit. Went back exactly to the starting level when I closed the history tabs.So maybe some other process jumped in and hogged lots of memory during the incident. Like Windows Update... I have a memory graph in my taskbar now, will watch for strangeness.
I'd still like a feature where if Vivaldi knows the reason for a dead bird, it is reported along with the icon. If I'd known this was a memory issue I'd have checked all the details while they were still available. As it happened, I noticed the Address Bar and all the Extension icons were not responding, and figured Vivaldi was just corrupted like it gets regularly, and needed a close and restart. (Now I wonder if those might be memory related, but they typically happen on wake from hibernation, not during a research frenzy.)
I'm sorry to seem so critical, I really love Vivaldi's ability to support my lousy vision and make my life more comfortable. I was even more critical of the other browsers when I was trying to use them...
-
@LorenAmelang , I never use hibernate in Windows, it always gives problems, I usually use suspend or I turn it off directly. Now with an SSD, the cold start does not take more than waking Windows from hibernation, which apart always offers memory problems that are full of junk files.
Microsoft has obviously never handled hibernation well to this day.
I use the same Windows 10 1909 last build 64.>Laptop Lenovo V145 15AST, AMD A9- 9425 Radeon R5 - 5 cores 3,1 GHz RAM 8GB, GPU 2+1 GB SSD 256GB -Win10 64 v22H2| Vivaldi last stable|
-
I still see nothing indicating Vivaldi is the cause of your memory issues. The growing graph is to be expected when opening lots of tabs.
What would be more interesting is to know what causes your physical memory to already be more than half filled by the time you start opening new tabs. Something on your system is hogging a lot of RAM and it's likely not Vivaldi. Obviously you'd hit the roof of physical memory sooner or later when opening a lot of tabs, then it will move into using the page file which obviously will be much slower.
On your system most of the memory seems to be spent already before you start opening new tabs.
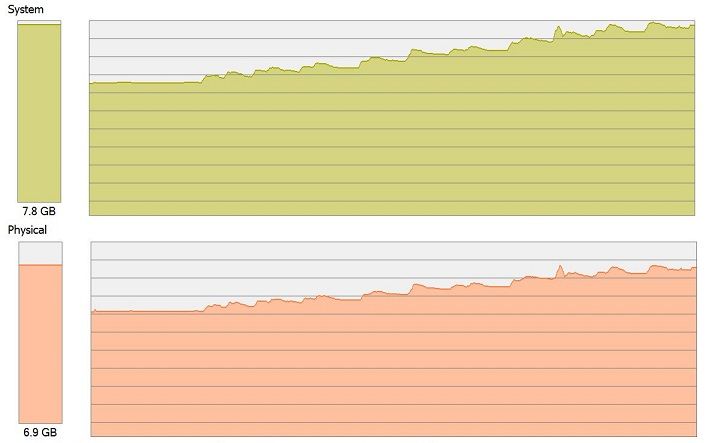
I have 16GB system, and with 15 tabs open system commit is 6.8GB. Vivaldi uses less than 1GB:

Memory usage here is Private Bytes / Working Set. The two large processes (apart from the parent) are the GPU process (6668) and a very bloated web app (9456).First you need to figure out what causes your memory to be so high even before you start opening tabs. Just do a sort by memory in Process Explorer. Also do it after a restart with no apps started.
Have you set a fixed size for your page file? It would look like it's set to 1GB which obviously is much too small for your usage. You need to let the system manage the page file unless you're very much aware of what memory use to expect.
Have you got enough free disk space to allow your page file to increase if needed?
🎻Volunteer helper · Forum moderator · Sopranos tester 🛠️Troubleshooting 🐛Report a bug 📜Markdown help
🦆"With a rubber duck, one's never alone" -Douglas Adams🦆 -
@Catweazle - Kind of agree... But a cold start means manually moving windows out from under my left-edge taskbar, or back over to the left edge when they move two taskbars right, or moving them right when they space away from the right edge in case the taskbar is there. And re-arranging taskbar icons that refuse to stay in a logical order. My original Mac+ had window placement totally under control in 1985, even remembered all my custom sizes for every app and folder view.
Guess I could suspend, but my life is 100% solar and I cringe a bit at wasting power when I'm sleeping. Plus the Surface Book battery is limited to 50% charge to try to slow the swelling problem that makes the screen bulge out... Hate waking up with it near empty.
-
@LorenAmelang
Hi, a bit of topic, I use hibernate for my Linux laptop too but I restart after major system updates or they never happen. It is the same on Windows except restart on Windows does not really is a cold start. Iirc you have to shut down and start to get a real restart.
How do you manage this?Cheers, mib
Opensuse Tumbleweed x86_64 KDE 6 X11, Windows 11 Pro, Vivaldi latest
HP Probook Intel(R) i5-8350U 16 GB, GPU UHD 620, SSD 256 GB
Miniforum-B550 AMD Ryzen 7 4700G 16 GB, Radeon Graphics
Xiaomi Mi Note 10 Lite Android 12 -
@Pathduck - Good questions! Here's the top of my Process Explorer:
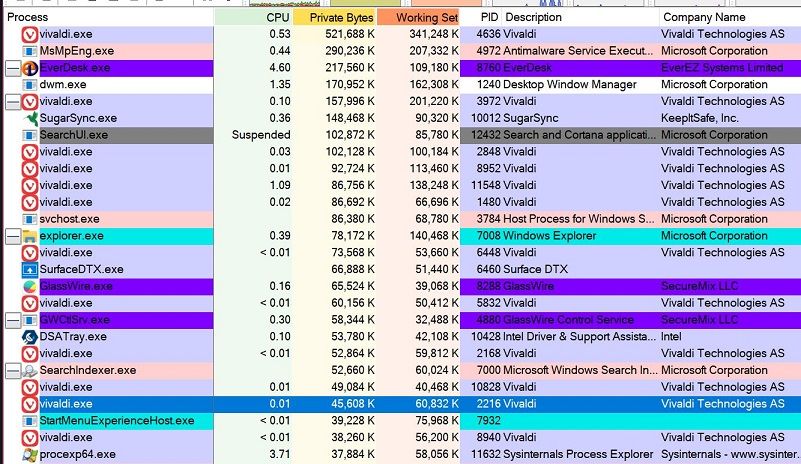
Somehow my GPU proc is much larger...? My GeForce GPU says it is not even being used atm. (EverDesk is my eMail client... )Several of my Vivaldi tabs seem bigger than yours. Is that my 3000x2000 screen? Though it is scaled to 175%...
Process Explorer adds all that up to 72% of hardware - but Resource Monitor adds the same numbers and says I'm only using 50%! (Of course it often shows only 50% CPU when my taskbar graphs are pegged and the screen is so hot my face is uncomfortable, so who knows how it counts things...) But when I try to add them in my head I get ~4GB, no way 6. Process Explorer must be adding in more than shows in the list?
Task Manager shows tiny sizes that don't match anything in the other apps, but adds them up to 70% used. Something strange going on here... It shows 670 MB for all 24 Vivaldi processes. When the others show almost that just for GPU.
Performance hits a brick wall when it begins using the page file, there is no point in letting it grow. Absolutely have to quit some stuff. But the SSD has 63GB free.
I doubt this could make any difference:
Command Line "C:\Program Files\Vivaldi\Application\vivaldi.exe" --flag-switches-begin --debug-packed-apps --enable-experimental-web-platform-features --enable-features=TabOutlinesInLowContrastThemes --flag-switches-end --enable-audio-service-sandbox --save-page-as-mhtmlThis is probably not a Vivaldi problem, but I appreciate everyone's thoughts!
-
@mib2berlin - When I have to restart Windows, I always check for updates, and once it restarts I keep checking for updates because it almost always finds more once the previous ones are installed. So you're saying I should power off once it says they are all installed and can't find any more? I've never heard that, but if it is true this machine hasn't really been restarted for many months! Will have to try that...
Original Surface Book, Win10; System76 gazp9, Arch Linux; iPad 12.9 5Gen; iPhone SE2020; synched...
-
@LorenAmelang What's the System Commit with no applications started after a reboot?
The PID 4636 is the GPU Process? It does seem very high. Maybe a laptop drivers thing. Windows Defender is also a memory hog as we can see...

You say you have a SSD with plenty of space - why don't you move the page file to this? Except of course if it's an external drive. I've moved my page file to the D partition, mostly for disk space reasons, as it's the same SSD as the OS. I have it set to be system managed, but with 16GB physical memory it rarely goes above 1GB which I believe is the minimum size it can be.
Memory management in any modern OS is somewhat akin to black magic, so it's hard to give definite answers on what data to look for. Here are some good articles:
https://dzone.com/articles/windows-process-memory-usage-demystified
https://docs.microsoft.com/en-gb/windows/win32/memory/working-setWhat is the
--enable-experimental-web-platform-featuresflag there for? It's not default, try turning it off and see if it helps.Another thing to try if memory is in short supply is use a 32-bit version instead. I use the 32-bit myself. 64-bit applications tend to use more memory simply because the address pointers are larger. Since Vivaldi uses a separate processes you won't hit the 32-bit limit unless you're using massive web apps taking up over 2GB of memory.
-
@mib2berlin said in Need a warning about running out of memory!:
@LorenAmelang
Hi, a bit of topic, I use hibernate for my Linux laptop too but I restart after major system updates or they never happen. It is the same on Windows except restart on Windows does not really is a cold start. Iirc you have to shut down and start to get a real restart.
How do you manage this?Cheers, mib
It is true that Windows 10 by default, when turning off the computer, enters quickstart mode, which is similar to hibernating, but this is configurable and if I turn off the PC it really turns off and when turned on it does it from scratch. This with an SSD disk is only negligibly slower than Quick Start mode (About 25 s (+entering password) until it is working and connected to the network.
I don't like to put it in Quickstart Mode or Hibernate, although it turns on a little faster (few), but it leaves a lot of junk in memory and a lot of temporary files. Not worth it on a current PC. This is why I prefer that shutdown really be shutdown.
-
@LorenAmelang
I am sorry, other way around, shutdown is kind of hibernate, restart work as expected.
@Catweazle description is much clearer.Cheers, mib
EDIT: Month without restart is also a huge security problem and updates need sometimes hours to finish. Once in a month is OK, I guess. -
So I've logged memory usage from my typical state, through a clean restart and two hibernations.
In Vivaldi Task Manager:
The GPU process freshly loaded uses 170MB. After a bit of use it is 255MB. Hib and wake takes that to 257MB. Another day's use takes it to 362MB.Through all of this my GPU insists it is not being used, Vivaldi is set not to use it.
"Extension: Dark Reader" varies from a single entry of 21MB to a two-line entry at 58MB.
My custom New Tab page varies from 39MB to 47MB. Other Vivaldi items vary similarly.
Resource Monitor on a fresh start, no apps, shows 40% used:
MsMpEng at 237MB
SugarSync at 167MB
dwm at 165MB
SearchUI at 134MB
explorer at 114MB
Registry at 106MB
Not even 1GB - clearly not telling the whole story...After days of use with my standard apps and only New Tab page currently open, it was at 50%. Closing apps 39%, restart 40%, open Vivaldi still 40% (the Windows items all shrank), hib and wake 44% (the Windows items grew), another hib and wake 49% (Vivaldi GPU grown huge...)
But 40% to 50% is 10% of 8GB, or 800MB. The changes shown don't nearly add up to that much space...
Through the same series of tests, Process Explorer after use is at 67%, close apps 50%, fresh start 42%, open Vivaldi 51%, hib and wake 57%, another hib and wake 64%.
So similar data at a fresh start, but growth of 25% or 2GB - despite similar small variations in all the similar sized apps shown. In that test, just opening Vivaldi consumed 42->51%, or ~720MB, which I guess is possible.
Looking specifically at my custom New Tab page, it varies from 317MB to 131MB in ProcExp, 317MB to 114MB in ResMon, and 47MB to 39MB in the Vivaldi Task Manager. I wonder what the VTM is reporting - the other views don't show any values near what it shows...
The Vivaldi GPU proc currently shows 170MB in VTM. Wait - I'd minimized the VTM window, and just taskbar previewed it to double check a few seconds later, and now it shows 344MB! Switched the GPU preference to use NVIDIA and it jumped to 408MB, and now moves a bit with every update of the VTM page.
Looks like "GPU" shows the same values the other apps call "Private Bytes". But for any other Vivaldi page, the value in VTM is like 1/3 of Private Bytes.
Now with my GPU control panel open (it uses 308MB!) and some other stuff, ResMon shows 46% used. But ProcExp shows 73% with pretty much the same items listed. My little tray graph is clearly agreeing with ProcExp.
The link to https://technet.microsoft.com/en-us/sysinternals/rammap.aspx is interesting, but I'm not sure how it relates to the other displays:
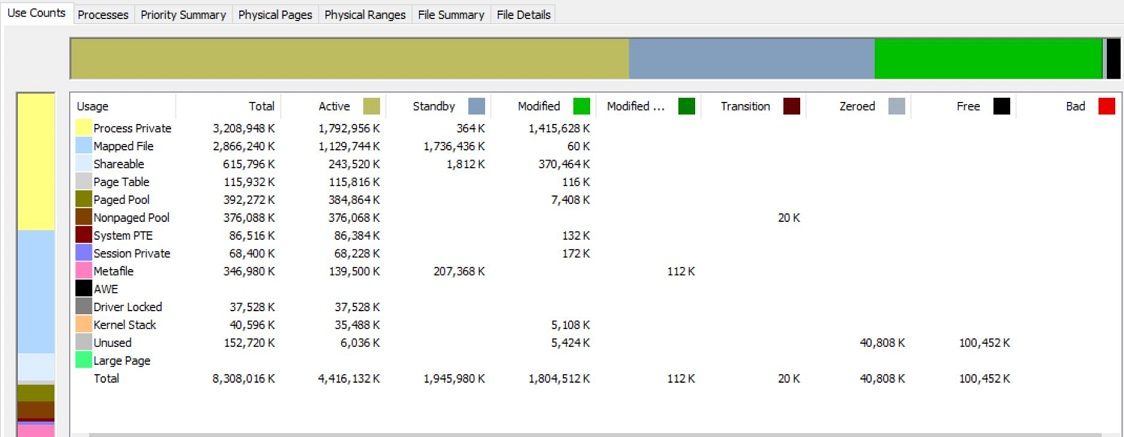
That's with ResMon showing 58% and ProcExp 81%...
What have I learned?
I like Windows Resource Monitor because you can see everything on one screen, but clearly it is as bad at spotting out of memory as it is at showing 100% CPU load. All those times I thought memory couldn't be the issue, it probably was.
None of the memory displays show where all the memory went! Something beyond the processes they show is using multi-GB of space before I open any of my own apps.
People have been posting about the Vivaldi and Chromium GPU process for many years, and all I've read just eventually give up trying to understand it. I have other things I need to do...
I guess 8GB of system RAM is just not enough to run a web browser any more. I'll be watchng my litte taskbar graph...
-
@LorenAmelang That's some good detective work, and a lot of information to parse
")
If I get the gist of what you're saying, there might be a memory leak in the GPU Process, possibly related to hibernation in Windows?
If you can consistently reproduce it, get as much data as you can, by going into hibernation and noting if the Vivaldi GPU Process increases in RAM usage after each start. Maybe it doesn't clear up the memory from the previous session and loads it all (drivers etc) again.
Then report it to the Vivaldi team. Most likely it's is a Chromium issue, but IMO better if you report to Vivaldi directly and they can decide if they want to move it upstream. Users shouldn't be forced to deal with the Chromium developers directly. It would help if you can reproduce it in stock Chromium and maybe even Opera, then they'd know if it's caused by Vivaldi or not.
🎻Volunteer helper · Forum moderator · Sopranos tester 🛠️Troubleshooting 🐛Report a bug 📜Markdown help
🦆"With a rubber duck, one's never alone" -Douglas Adams🦆 -
@Pathduck - There might be a memory leak, but it seems more likely that the GPU process just varies wildly in its memory usage. On a fresh start it may be 170MB, but with even a bit of use the minimum is more like 300MB, and since enabling the hardware GPU I've see Vivaldi's GPU process showing almost a GB by itself. It was 400MB when I began typing here, now it is 500MB.
I was not very clear about the "hib and wake" tests, each one included a few hours of random usage before the hibernation. The growth in memory usage was during the usage, it woke from hibernation with almost the same footprint it had previous to being off.
One new thing I'm curious about... Most of my open tabs show a minute or two of CPU time in Vivaldi Task Manager. "App: Vivaldi" shows 6 minutes. "Browser" 42 minutes. But one tab
https://www.jstor.org/stable/j.ctt1ww3v7x
from the same research session as the others shows 18 minutes. There is no obvious media activity, mostly just text on the page. Its CPU column never leaves 0.0 now, while other tabs show occasional bursts.Since peeking at that tab, my GPU memory shows between 700 and 800MB... Constantly changing now that my hardware is enabled.
Guess I'll never understand everything... The only conclusion I can report is that an 8GB Windows machine is now hopelessly obsolete. Like the 16GB iPhone I just replaced. It is our duty to fund "progress"!
Original Surface Book, Win10; System76 gazp9, Arch Linux; iPad 12.9 5Gen; iPhone SE2020; synched...


