100% Disk Usage
-
So I recently updated (on March 15, 2020) Vivaldi to the latest version (currently 2.11.1811.47) and it is maxing out the disk usage to 100% as soon as Vivaldi is opened/running (As shown in the screenshot below).
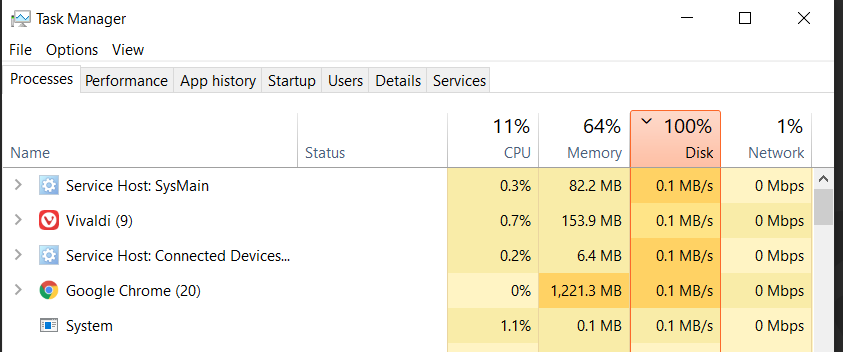
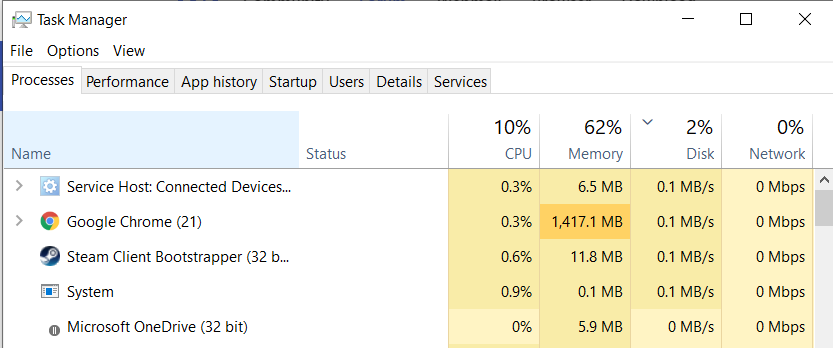
This screenshot is when Vivaldi is not running.
I tried clearing caches and browsing history, did not work. Also tried reinstall, did not work either.
Not sure what else to do to fix the situation, or if I should wait for the next update to possibly patch it.
Any advice would help, thanks.
-
@darkstar9386 Try shutting down Google Chrome. That seems to be using most of the resources.
Blog • Vivaldi Review • Server Status
Specs: AMD Ryzen 5 3400G, 8 Gb • Win 10 64-bit build 19045.2486 • Snapshot 6.7.3327.3 (64-bit) -
@Pesala I tried with Chrome running, and with it not running, its only when Vivaldi is running that this problem happens
-
@darkstar9386 Something is using a lot of disk IO but from the screenshots you show, there is no clear suspect. Disk usage says 100% but neither Chrome nor Vivaldi is using it, they're only at 0.1MB/s which is just the lowest value Task Manager can show. It just means its just using disk.
It would help to close down Chrome anyway just to get one suspect out of the way.
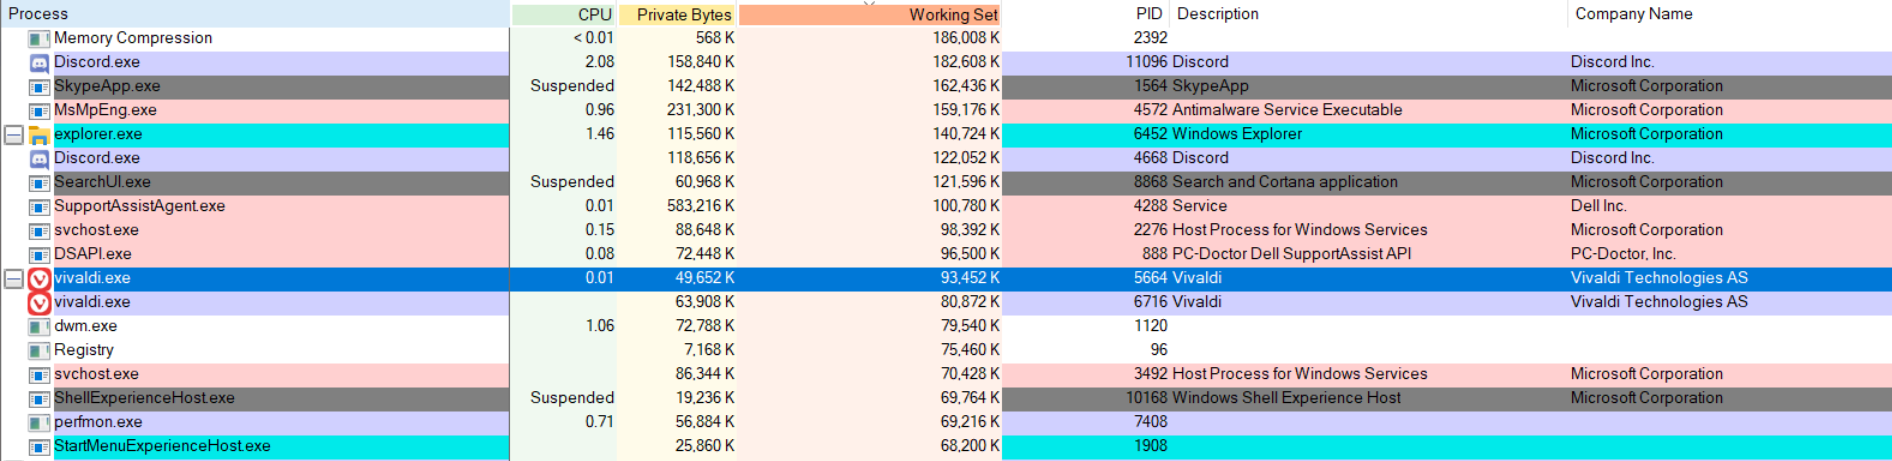
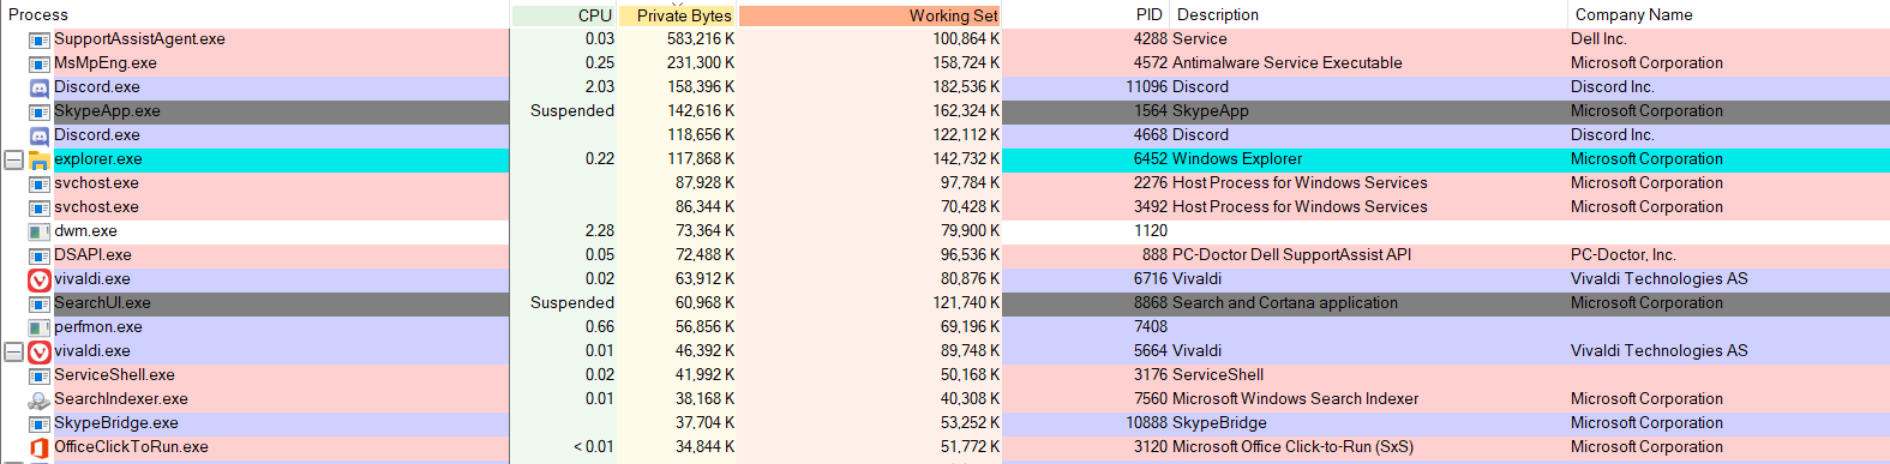
Process Explorer is a much better tool than Task Manager to figure out resource usage:
https://docs.microsoft.com/en-gb/sysinternals/downloads/process-explorerIf you show the columns IO Delta Read and Write it could help find where that disk usage is coming from. For comparison, here's how it looks with Vivaldi idle and 5-6 tabs open:

OR you could go to the Details tab in Task Manager, and show IO Reads + IO Writes and watch for processes that do a lot of disk activity.
-
What version of Windows are you on? And is it fully updated? You can verify that by doing a check for updates in the settings if you're on Win10.
I would use the Resource Monitor to figure out what's hitting the hard drives and how. You can find it in the start menu, or if you click go to the Performance tab of Task Manager since you've got that open, there's a link at the bottom of the window that will launch Resource Monitor directly.
Once you're in Resource Monitor, go to the Disk tab, and maximize the window to give yourself some room to work. There are 3 sections in the Disk tab. In the top one you can change the sort order by clicking the column headers just like you did in TaskMan, sort by total data rate. Then you'll see which processes are hitting your drives hard. Click the checkbox(es) next you the process(es) that are heavily accessing the drive(s). This limits the lower sections to only show data related to the selected process(es).
Now go to the section that shows which files are being accessed, called Disk Activity. Note that you can resize the sections by moving the dividers up & down, so in the step above you might want to make the first section larger, and in this step you probably want to take up most of the maximized window with this files section as often there will be a long list of files depending on what the process is doing.
Take some screenshots through all of this to share so we can see what's going on and assist you as well. But now you should have a fairly good idea of what is happening. Perhaps Vivaldi is needing to pull down a lot of data from the sync server (assuming it's Vivaldi related), or is writing to the logs. Maybe the search index is being built.
I recall I had a similar event occur on my system, I forget exactly what Vivaldi was doing, but it was benign, and everything settled down as soon as it completed.
Note: I'm not at my desk now so I may have misnamed some of the tabs, etc. The instructions should still get you there though.
-
I would recommend other columns in Process Explorer.
Enable the I/O History and CPU History
Also enable them as tray icons. You can see which task is using most just by hovering over the tray icons -
-
@darkstar9386 What kind of hardware are you running this on?
And do you run any sort of 3rd party security software?
Volunteer Mod and tester on Windows 11 Home X64, i7-13700 @ 5.4 GHz turbo; Intel UHD 770 graphics; 1TB NV2 PCIe 4.0 NVMe SSD; 32 GB DDR4-3200 RAM. Community Code of Conduct
-
@darkstar9386 said in 100% Disk Usage:
@BoneTone @Pathduck So I did run both the programs, and from what I've seen, its still only when Vivaldi is opening up/trying to load webpage.
Resource Monitor - Vivaldi Running
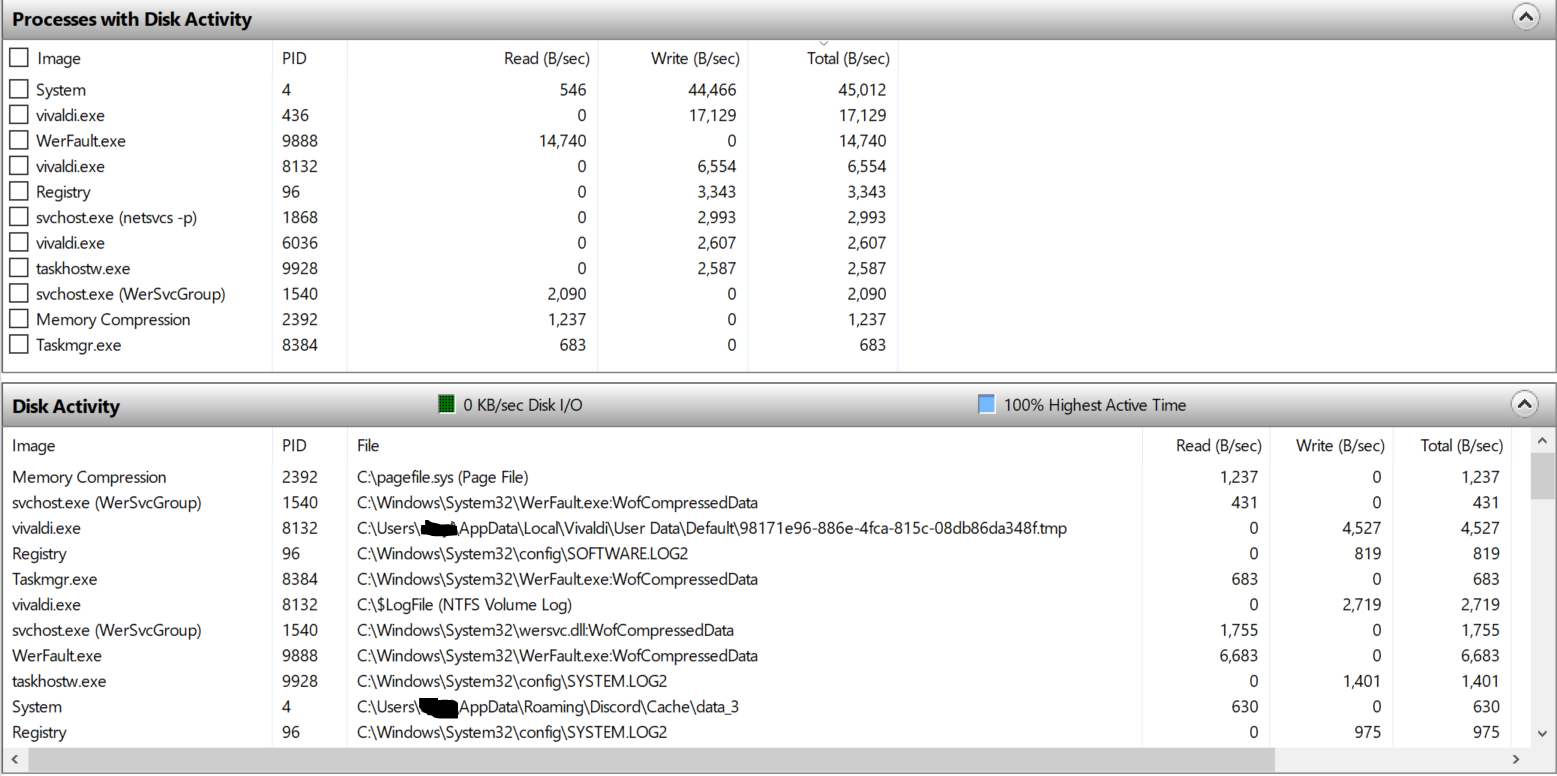
Yup, Vivaldi is just writing to the logs, at least that is all I can see in the screenshot. It'll help if you do the step I mentioned and check the box next to the processes that are at the top of the Total data rate sort. This limits the Disk Activity section to files being accessed by the selected process(es) only. Then you can raise the bar between Disk Activity and Processes sections to give more space.
None of the processes are accessing (reading or writing) a lot of data, tens of kilobytes per second, that's nothing. What the Highest Active Time is measuring is the time the disc is not idle and is busy serving requests. When you see high percentages like this, you're almost certainly looking at a problem with the disc, and its becoming a bottleneck to performance. This can be due to a highly fragmented drive, which can be resolved by defragmenting it. It could be due to thrashing, and seeing your page file in the that is definitely a suspect. To address that you'll need to tweak your virtual memory settings.
Also, next time you take a screenshot of this app, adjust the column sizes to include all the columns in the image if you can. I/O Priority and Response Time are missing and can be helpful. But my first guess here is that you've got some thrashing going on with the page file, second guess is a fragmented disk.
-
Oh, I also noticed that WerFault.exe is in the top 3, the 3 that are most significant in terms of total data rate. You could try disabling the Windows Error Reporting service to see if that helps at all.
Looking at the numbers again... I just saw the page file at the top, but you gotta check the boxes on those 3 processes, then do another sort on the total column and screenshot that, then do a sort on the I/O column and screenshot that. The Disk Activity list you have shown there doesn't show what files System is accessing that would add up to 45K, the list is too crowded.
-
@Ayespy
Windows 10 1909
Intel i5-6200U
8 GB ramWith security software, its only AVG
-
@darkstar9386
Your system resources should be more than adequate.It is possible for AVG to be intercepting and examining every operation that Vivaldi attempts, before permitting it. It has been known in the past that AVG has failed to "trust" Vivaldi, and has either blocked it, slowed it, or consumed system resources monitoring it, every time Vivaldi is opened.
-
@Ayespy said in 100% Disk Usage:
@darkstar9386
It is possible for AVG to be intercepting and examining every operation that Vivaldi attempts, before permitting it. It has been known in the past that AVG has failed to "trust" Vivaldi, and has either blocked it, slowed it, or consumed system resources monitoring it, every time Vivaldi is opened.Except I don't see any avg related process in the resource monitor hitting the drive. The 3 main culprits are System, vivaldi.exe, and WerFault.exe, in that order, Plus Memory Compression hitting the page file.
However, there is very little data throughput for any process, which suggests that the the reason for the high access time is lots of little files. With the page file being one of the files being accessed, and only 8 GB of physical RAM, it's quite possible the virtual memory is thrashing.
@darkstar9386 did you see my previous posts? Think you can follow up with that investigation? It may narrow down the issue. Are you experiencing any problems, or is it just that you noticed this one meter was maxed? If you aren't having any performance problems, I'd be inclined to think this is a non-issue. If it's Vivaldi, it's just writing to the log and it'll finish in a little bit. If your virtual memory is thrashing, you'll want to change its settings to address that, and possibly add some more physical RAM. So, in addition to what I wrote above, it would be good to know what your virtual memory settings are.
-
@darkstar9386 , I can see that the Windows error report is working, (WerFault.exe) this can precisely cause some system errors, if it is working.
https://rizonjet.com/fix-werfault-exe-application-error-in-windows-10/
-
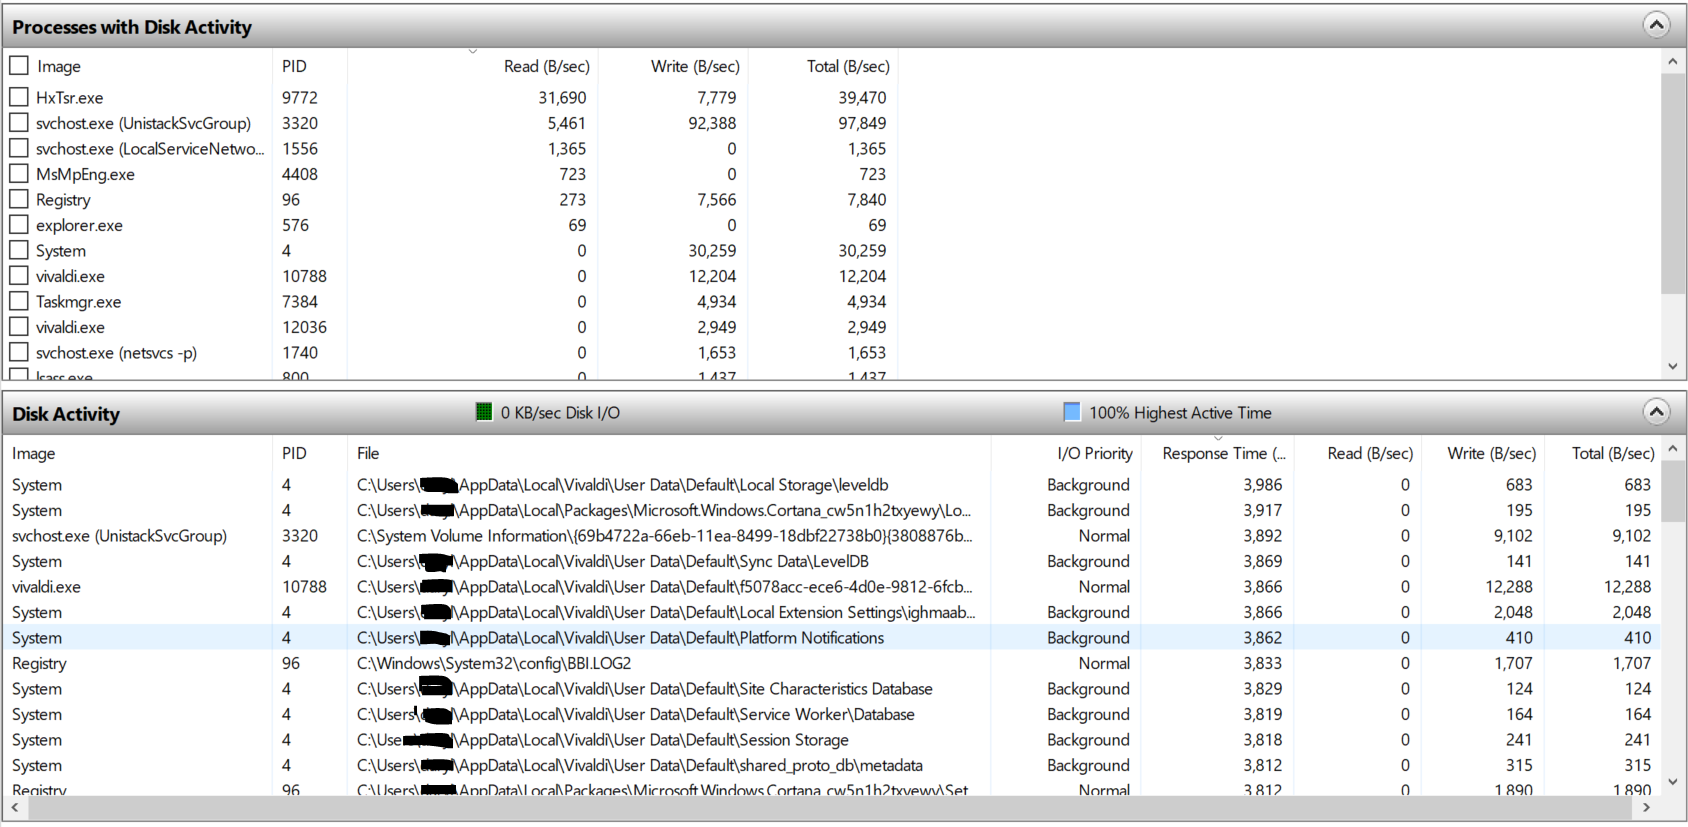
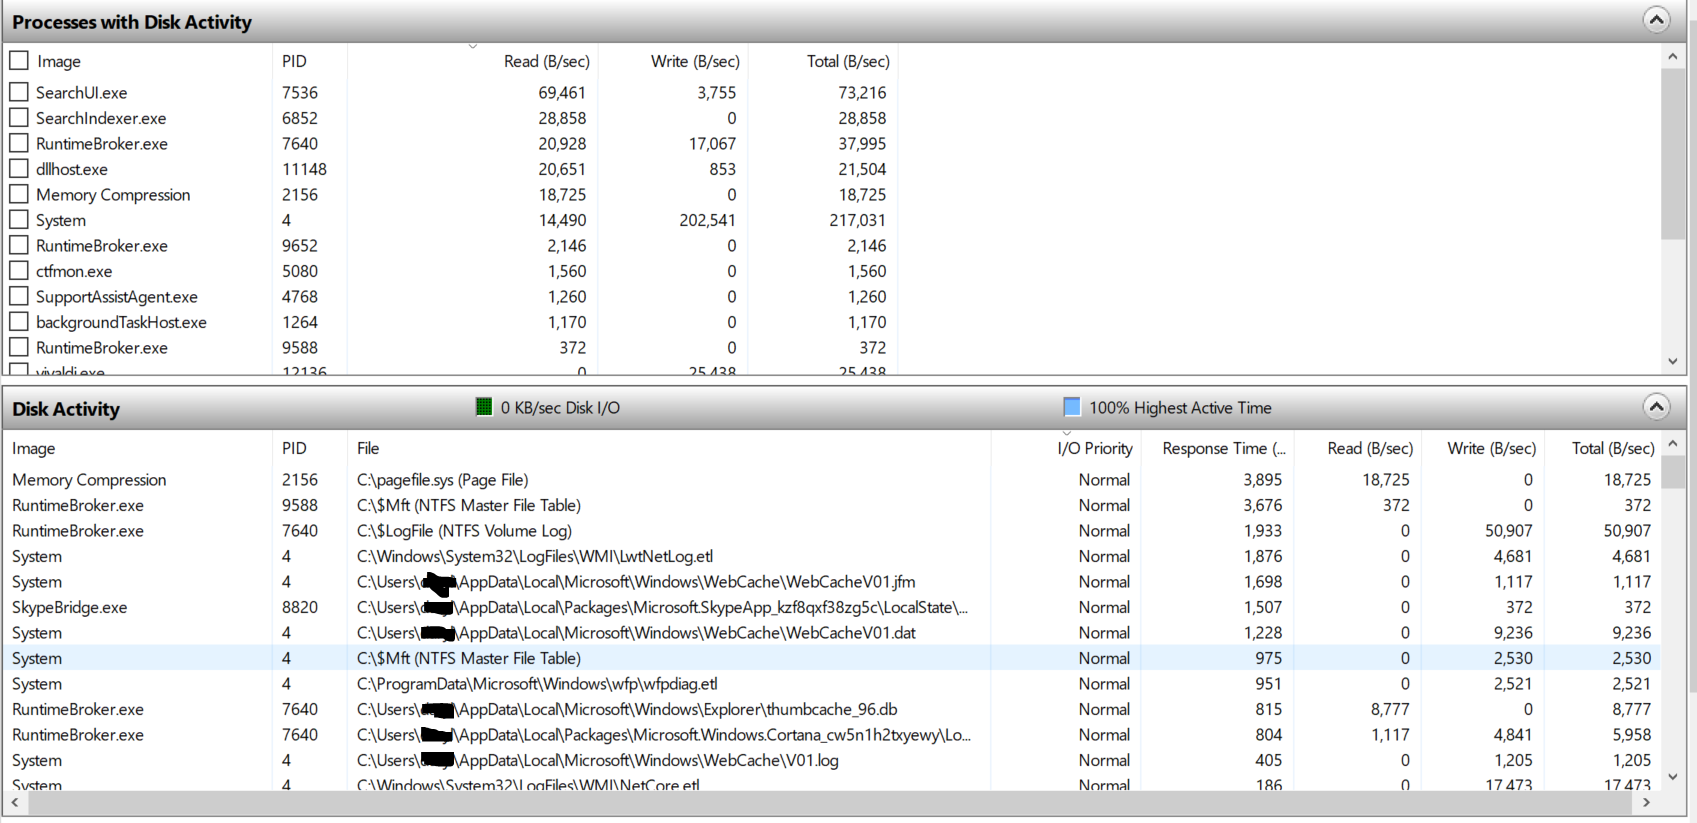
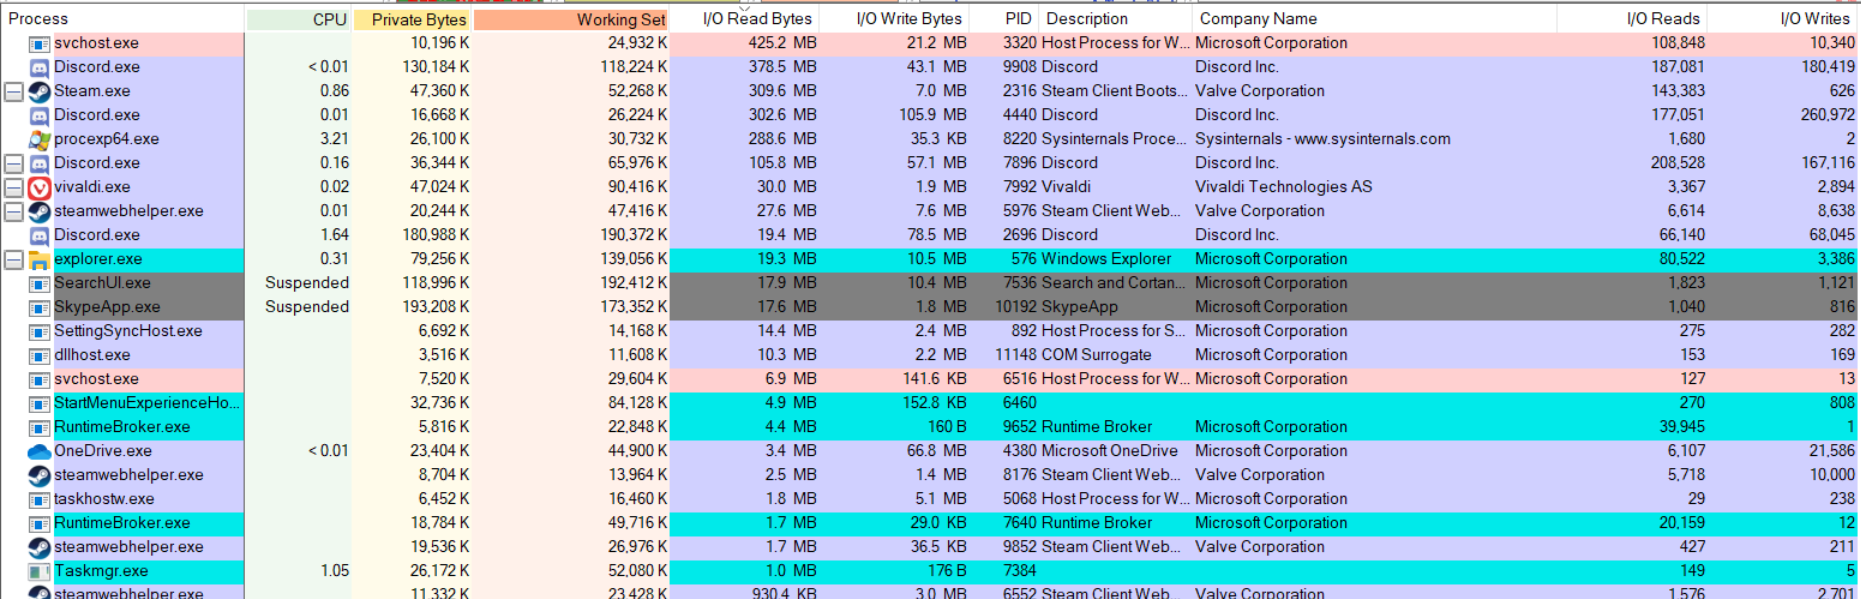
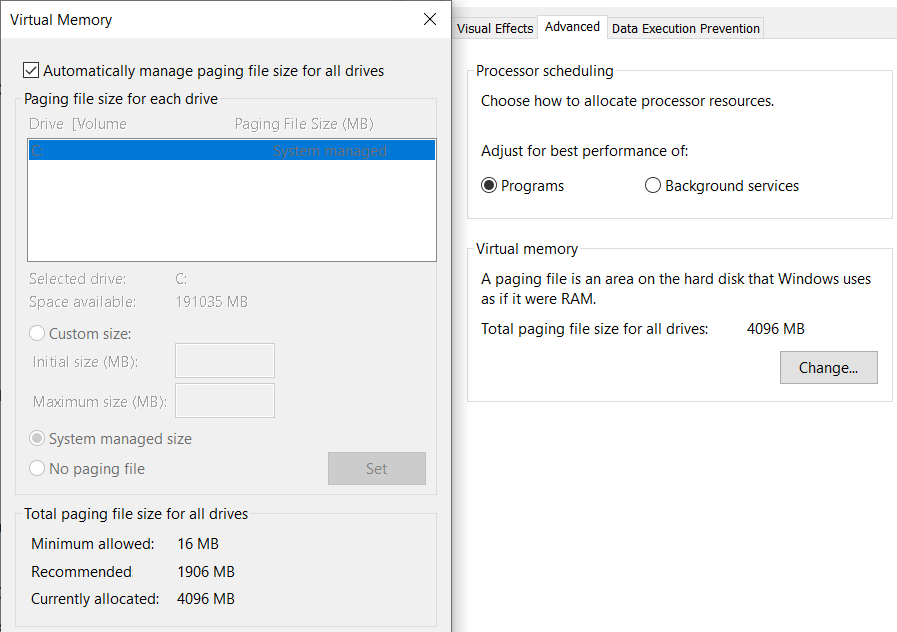
@BoneTone sorry I didn't reply earlier, just busy with work, but I did take the screenshots with the I/O Priority, Response time, I/O Read Bytes, and Virtual Memory.
It's only when opening Vivaldi that Disk becomes 100% and essentially only when Vivaldi is running, no other program (besides VMWare when I use it) have this problem. When I leave it to run for a bit Disk Usage does go down, but goes back to 100% when I try to go to another page.
Changing the physical RAM might be a bit difficult since its a laptop.
@Catweazle I did try a few of the methods, they were nice to know about, didn't know about them, but sadly did not solve the problem.
ResourceMonitor - SortByRead_ResponseTime
ResourceMonitor - SortByRead_I/O Priority
ProcExp - SortBy I/O ReadBytes
Virtual Memory Settings
-
@darkstar9386 As this does not happen on other systems at this time, with current versions, that argues strongly for the problem being local to you. I still lean toward the idea that something on your system is actively interfering with Vivaldi, and not other programs. This would not be the first time that software aimed at system security singled out Vivaldi (because it's new, unfamiliar, "not trusted") and interfered with it.
If you had a badly fragmented disk (and Win10 is supposed to prevent that these days) it should affect other programs with excessive swapping and thrashing as well, not just Vivaldi. Vivaldi, as it is written, does not NEED excessive disk access. It just doesn't. Therefore, other factors need to be explored.
I wonder how long you have been using Vivaldi - over a year? Some problems from a long time ago could have been brought forward if you just kept updating an old profile over and over and never corrected them.
For fun, why not refresh your profile and see if anything improves. It can't hurt, and may help.
Edit: I'm sitting here flipping from tab to tab, opening and closing pages, following links, etc. and can't get my main disk access to exceed 1%. 1%. That is all Vivaldi needs.
-
@Ayespy yeah, I tried looking it up from other forum posts, they didn't seem too similar as whats happening with my problem.
I've been using Vivaldi for around over a year, and haven't had this problem, and I do enjoy using it. I'll give the profile refresh an attempt and see how that works.
-
@Ayespy so I did try the refresh profile method, and it has given me way better results. Specifically, Disk usage has looks like something that would be normal to see, a bit highish at startup but goes back to around 1%ish.
It possibly might have been the extension, it was an ad-blocker, that I think was taken down. I'm gonna try adding back all the things I had except the extension and see how it does.
-
@darkstar9386 you're in the middle if a sync aren't you? The sync USB or something got corrupt so it's trying to do an initial get again.
Open up vivaldi://sync and you can investigate what's going on in there. Look at what is hitting your hard drive... there's only 1 entry from the vivaldi.exe process, and a bunch from System.
@Ayespy said in 100% Disk Usage:
This would not be the first time that software aimed at system security singled out Vivaldi (because it's new, unfamiliar, "not trusted") and interfered with it.
But, I don't see any security software being active in the list. The issue is the hard drive has high activity. Looking at the resource monitor we see that Vivaldi's sync related files are being written, mostly by the System process, at least in the part of the list we can see. This fits with what I was saying based just on the symptoms, low data throughput but high disk activity measurement suggests lots of little files being written. That's exactly what we see in the resource monitor.
This keeps happening every time @darkstar9386 launches Vivaldi because he never lets it finish. The next time he starts up Vivaldi it restarts what I'm guessing is an initial get from the server.
-
Ah dang, you refreshed your profile. Ok, nuclear option, but it clearly demonstrates that it was an issue with your profile. Could be that extension you mention was in a funky state, but looking at the resource monitor we can see exactly which files are being touched. I'm not at my desk right now so I can't look to see what the guid that vivaldi.exe was writing to is exactly. But we definitely see a bunch of writes happening that occur during a sync.
I know this specific pain, though it happens to me on Android not my workstation. Somehow my profile gets into some weird state where there's a sync conflict it cannot resolve. Eventually, after failing to successfully complete a sync, something else happens and it decides it's time to download all 850,000+ records from the server. That takes many hours to complete and typically fails several times, thus restarting each time. At some point s few days later, often seth me babysitting it, the "initial get" completes and no data is lost. I can't just blow away my local profile because that would result in data loss, I need it to upload several hundred to a few thousand bookmarks that have been created during the period when it wasn't able to sync successfully.
Anyways, if you see those files being written when your disk is reporting 100%, which BTW only means that there was disk activity, not that the disk is maxed our for the measurement time frame. Then open up that sync internals page and look at the events and the log, and you should be able to see what's going on. Watching those you can see if it fails, or completes. When it finally finishes your drive should return back to normal.
One last thing, since you didn't reply to it, I guess there weren't really any other symptoms of a problem? No performance issues? Your disk still had plenty if bandwidth available, and other performance measurements were fine. The 100% just means that for whatever the rolling average timeframe is, there wasn't ever any idle time. As I mentioned, this is different than the drive being maxed out and unable to handle more data.